April, 2007
The Embassy of Japan
Japanese business circle is experiencing an “Indian Boom”, with a high expectation for business opportunities here and activating further investments in the Indian market. The surveys of Japanese manufacturing companies operating abroad conducted by Japan External Trade Organization (JETRO) and Japan Bank for International Cooperation (JBIC) indicate that India is the second most prospective investment destination abroad next to China for the Japanese business circle.
The Embassy of Japan made the first version of “Japan’s Active Engagement in Business Cooperation with India” in January 2006. This paper is the updated version of the former paper with the latest statistics and information.
1. Japan’s Foreign Direct Investment (FDI) to India
1-1. Japan’s FDI to India doubled during 2005 to 2006
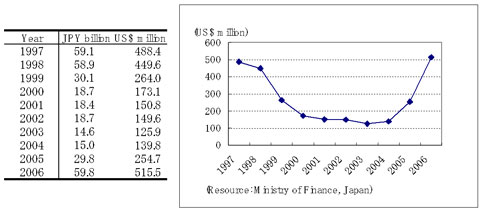
According to the data released by the Ministry of Finance of Japan, Japan’s
FDI in 2006 was 59.8 billion yen (US$ 515.5 million), which has doubled from
29.8 billion yen (US$254.7 million) in 2005 (Figure 1). FDI inflows in 2006 are the
largest annual FDI inflows from Japan to India (the last peak was US$ 488.4 million
in 1997)1.
Figure 1: Net Inflows of FDI from Japan to India
* On the other hand, the data released by the Ministry of Commerce and Industry of India also shows the steady increase of Japan’s FDI to India since 2003 (Table 1). The country-wise FDI statistics by the Ministry of Commerce and Industry of India includes only fresh investments, therefore the amount of FDI is far less than actual FDI amount including reinvestments and long-term borrowings from abroad.
Table 1: Year-wise FDI from Japan to India
|
Year
|
Japan's FDI to India (US$ million)
|
|
2003
|
94.4 |
|
2004
|
116.0 |
|
2005
|
168.0 |
|
| (Resource: Ministry of Commerce and Industry, India) |
* In addition to the amount of investment
shown above, Japanese companies are also
investing in India through their subsidiary
companies in third countries, mostly
those in ASEAN. According to SIA Newsletter
published by the Ministry of Commerce & Industry
of India, during the time between April
2006 and November 2006, Japan invested
about US$ 5.15 million in India through
Japanese subsidiary companies in Singapore.
1-2. Japan’s FDI to India will amount to around US$ 5.5 billion over 5 years
Only by totaling 27 FDI projects reported in Japanese media, Japan’s FDI to India will amount to around US$ 5.5 billion over 5 years from 2006 to 2010. The major FDI projects are as follows2 .
| Maruti-Suzuki3 |
US$ 2564 million (¥ 300 billion) |
| Toyota Motor Corporation |
US$ 385 million (¥ 45.0 billion) |
| MCC PTA |
US$ 364 million (¥ 42.5 billion) |
| Nissan Motor |
US$ 231 million (¥ 27.0 billion) |
| Honda Siel Cars |
US$ 175 million (¥ 20.5 billion) |
| Asahi India Glass |
US$ 111 million (¥ 13.0 billion) |
2. Japan’s portfolio investment (FIIs)
There has been an increase in the number of portfolio investment funds through which Japanese people can invest into Indian stock market. After the first “India portfolio investment funds” was set up in 2004, the number of such funds was doubled from 8 in November 2005 to 16 as of March 2007, attracting large Japanese investments to Indian stock market. The net asset of the Japanese “India portfolio investment funds” as of March 2007 is US$ 8.2 billion, increased from that of US$ 4.7 billion as of the end of November 2005. A significant amount of portfolio investments from Japan have been invested in India.
Figure 3: List of “India Portfolio Investment Fund”
| Name of Investment Companies |
Name of Funds |
Net Asset (Unit: billion yen)
(million US dollars) |
Net Asset (Unit: billion)
yen (million US dollars) |
| As of 12 March, 2007 |
As of the end of
November, 2005 |
| Nomura Asset Management Co., Ltd. |
Nomura India Security Investment |
107.7 ($920.5) |
117.2 ($1001.7) |
| Shinko Investment Trust Management Co., Ltd. |
Shinko Pure India Equity Fund |
72.2 ($617.1) |
- |
| JP Morgan Asset Management Co., Ltd. |
JF India Fund |
16.7 ($142.7) |
33.0 ($282.0) |
| JP Morgan Asset Management Co., Ltd. |
JF Indian Stock Active Open Fund |
13.9 ($118.8) |
- |
| Deutsche Asset Management |
Deutsche Indian Securities Fund |
31.6 ($270.1) |
9.9 ($84.6) |
| Mitsubishi UFJ Asset Management Co., Ltd. |
Deutsche Indian Securities Fund |
14.8 ($126.5) |
16.6 ($141.9) |
| BlackRock Japan Co. Ltd. |
BlackRock India Equity Fund |
108.7 ($929.1) |
- |
| HSBC Investments (Japan) K. K. |
HSBC India Open Fund |
120.9 ($1033.3) |
82.2 ($702.6) |
| Credit Agricole Asset Management Japan Ltd. |
CA Risona India Fund |
42.7 ($350.0) |
- |
| Sumitomo Mitsui Asset Management Co., Ltd. |
Mitsui-Sumitomo India-China Equity Fund |
30.9 ($264.1) |
- |
| PCA Asset Management Limited |
PCA India Equity Open |
126.2 ($1078.6) |
76.4 ($653.0) |
| PCA Asset Management Limited |
PCA India Infrastructure Equity Fund |
62.9 ($537.6) |
- |
| Shisei Investment Management Co., Ltd |
Shinsei UTI India Fund |
28.3 ($241.9) |
- |
| |
Sub-total |
777.5 ($6645.4) |
335.3 ($2865.8) |
| |
| Products for sale registered in third country |
Net Asset (Unit: billion)
yen (million US dollars) |
Net Asset (Unit: billion)
yen (million US dollars) |
| |
Name of Funds |
As of the end of January, 2007 |
As of the end of September, 2005 |
| |
Fidelity World Funds - India Focus Funds (Luxembourg) |
54.8 ($452.9) |
53.4 ($472.6) |
| |
Nikko Fidelity Global Select - India Advantage Fund (Luxembourg) |
129.1 ($1066.9) |
158.0 ($1398.2) |
| |
UOB Indian Equity Fund (Ireland) |
1.4 ($ 11.6) |
- |
|
Sub-total
|
185.2 ($1530.5) |
211.4 ($1870.8) |
|
Total
|
962.7 ($8175.9) |
546.7 ($4736.6) |
|
| Source: Investment Trust Association of Japan database, Japan Securities Dealers Association database |
| Exchange rate for computation; |
1 US dollar = 113 yen (for September 2005)
1 US dollar = 117 yen (for November 2005 and March 2007)
1 US dollar = 121 yen (for January 2007) |
3. Bilateral Trade between India and Japan
3-1. Bilateral Trade between India and Japan doubled in 4 years
According to the data from the Ministry of Finance in Japan, bilateral trade between Japan and India has been on the steady rise since the year 2003, and the amount was more than doubled from US$ 4.0 billion in 2002 to US$ 8.6 billion in 2006, which increased by 27% from US$ 6.8 billion in 2005.
Figure 3: Trade between India and Japan, from 1998 to 2006
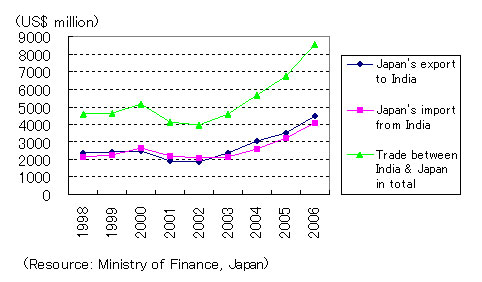
* The rapid expansion of bilateral trade has occurred in both ways in 2006 from the previous year (Japan’s import and export from/to India marked respectively more than 26% increase). Especially, the import of “petrochemical products” from India to Japan rapidly increased from US$ 544.4 million in 2005 to US$1,130.4 million in 2006, and became the top import item from India to Japan, overtaking the traditional top item of “gems and jewels”. Japan’s export to India also increased more than 26.8% (in US dollar terms) mainly because the volume of each of the major items of exports, such as machines, electronics, and transport equipments has increased substantially.
* Trilateral trade among Japan-ASEAN-India of components as well as final products has heavy weight in the Japan’s regional trade structure though these transactions never appeared in the Japan-India bilateral trade statistics. One such example is the Toyota-Kirloskar Auto Parts Private Ltd in Bangalore commissioned in June 2004, which is exporting 100% of their products such as transmissions to Toyota’s local companies in ASEAN.
3-2.
Japanese Joint Ventures in India are
also contributing to India’s export to
third countries
Recently Japanese joint venture companies in
India are investing further and expanding production capacities for the purpose
of exporting goods manufactured in India to third countries. The major trends
among automobile makers are as follows.
Maruti Suzuki has exported 35
thousand cars or around 6.6% of domestic sales of 527 thousand units to third
countries in FY2005. In addition, Maruti Suzuki invests JPY 300 billion (US$
2564 million) during FY2005~2009 to build a new production plant in Manesar,
and to update the existing plant in Gurgaon. They are planning to export 200
thousand cars annually from these plants. Honda
Group (Hero Honda and HMSI) has exported 131 thousand two-wheelers
against 3.47 million domestic sales in FY2005. Nissan
Motor, which
decided to build a new plant in Tamil Nadu,
is also planning to export their cars manufactured
in India to European countries.
These trends indicate that there has been a
qualitative change
of
the strategies of Japanese companies, and that
some leading Japanese companies have started
considering India as a future export hub of
their products. These trends are expected to
facilitate export from India furthermore in
the future.
4. Increased presence of Japanese business in India
According to the information provided by various
Japanese establishments in India (Consulate
offices, Japanese Chambers of Commerce and
Industry in Ind
ia,
JETRO Bangalore), there are 475 Japanese business
establishments operating in India. The numbers
of Japanese business establishments from Aug
2003 to Feb 2007 are as follows.
| Aug 2003 |
231 |
| Jul 2004 |
276 |
| Apr 2005 |
298 |
| Jan 2006 |
328 |
| Feb 2007 |
475(*) |
* The definition of Japanese establishments counted has been changed since Feb 2007. Until Jan 2006, the definition of Japanese business establishments counted was, in principle, those establishments which have the presence of Japanese staff. Based on these original definitions, the number of Japanese business establishments as of Feb 2007 is 381.
* It is observed that, however, increasing number of small and medium size Japanese enterprises started founding their establishments in India in recent years. And Japanese companies in this category are often in the investment modality without resident Japanese staff. Therefore from Feb 2007, the definition of Japanese establishments counted expanded to include the branch offices and liaison offices of Japanese companies and the headquarters of Japanese subsidiaries and joint ventures even though they do not have resident Japanese staff.
1The statistics on FDI, released by Ministry of Finance of Japan includes both fresh money and reinvestment.
2These figures are not confirmed by each individual companies to the Embassy of Japan.
3The period of estimation for Maruti Suzuki is from FY2005 to FY2009.
|